Somebody’s Watching Me
Video not displaying? Click here: http://www.youtube.com/watch?v=OlUYhlvYzCc.
Project Description
General
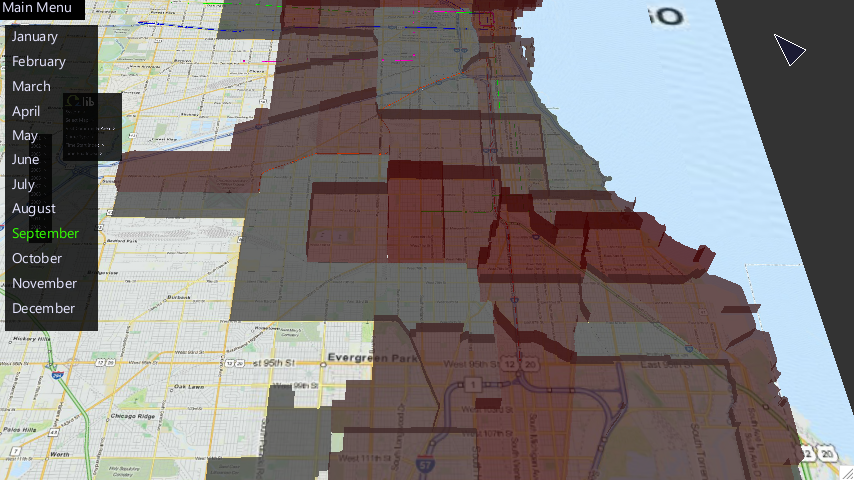
This project is a visualization of the 2001 - 2013 crime data in Chicago and includes 5,000,000+ entries. The ground plane uses images from OSG, Google, and Yahoo maps to see an overview of the city of Chicago. On top of the image maps are extruded polygons that represent the community areas of Chicago. These community areas contain crimes that are within their boundaries and their geometric representation’s height and color is a function of the number of crimes they contain. In addition, the CTA L lines and stations are displayed geometrically in the appropriate location relative to the ground plane maps. The community areas, crimes, and CTA data was downloaded from data.cityofchicago.org and were modified to be used in the program. Explanations of how the data was modified is in the Data Explanation section.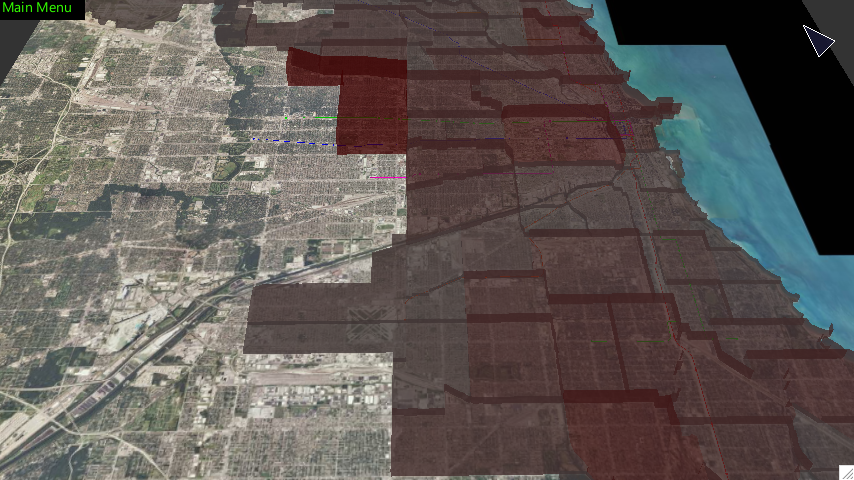
Functionality
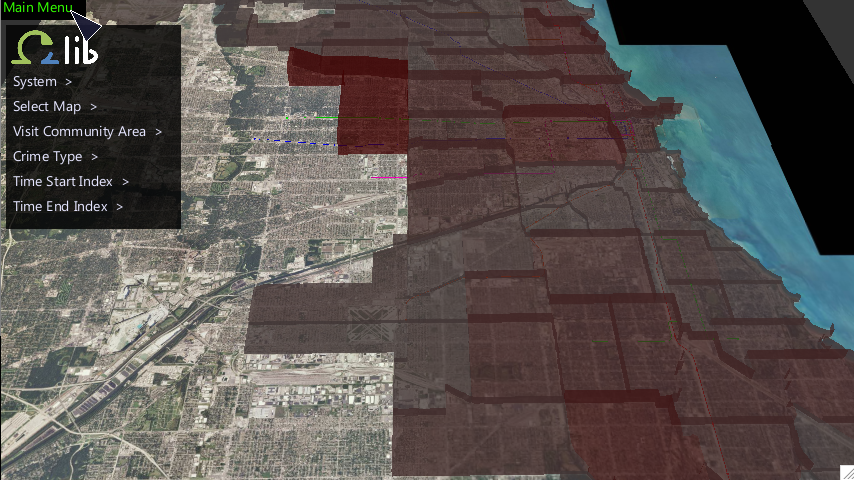
This project was built using omegalib and so inherits the ability to navigate space either with CAVE2’s tracked wand or the mouse if run on a computer. The omegalib menu was extended to include functions specific to this project:-
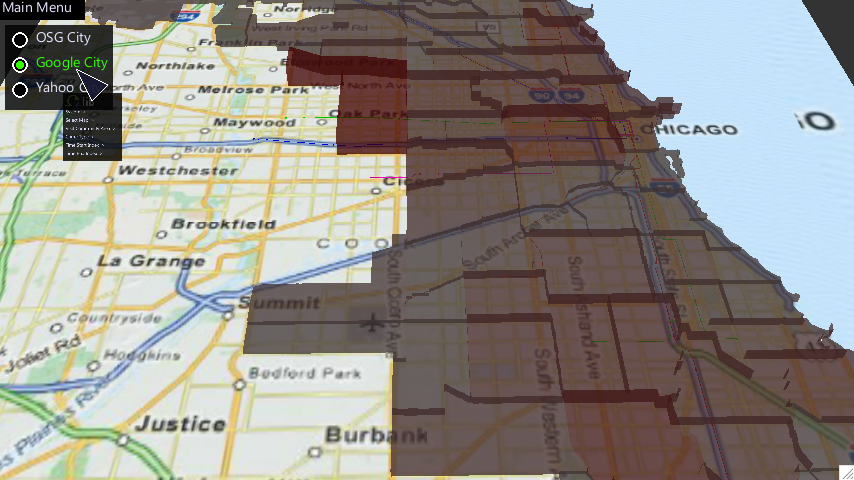
“Select Map”
This menu has three buttons, “OSG City”, “Google City”, and “Yahoo City”. Selecting any one modifies the ground plane images to use the corresponding images on the ground plane.
-
“Visit Community Area”
This menu has an “Overview” button, a “Previous” button, a list of n community area buttons, and a “Next” button. Selecting “Overview” positions the camera to see the entire map while each community area positions the camera to see that community area. The “Previous” and “Next” buttons toggle to the previous / next n community area entries. -
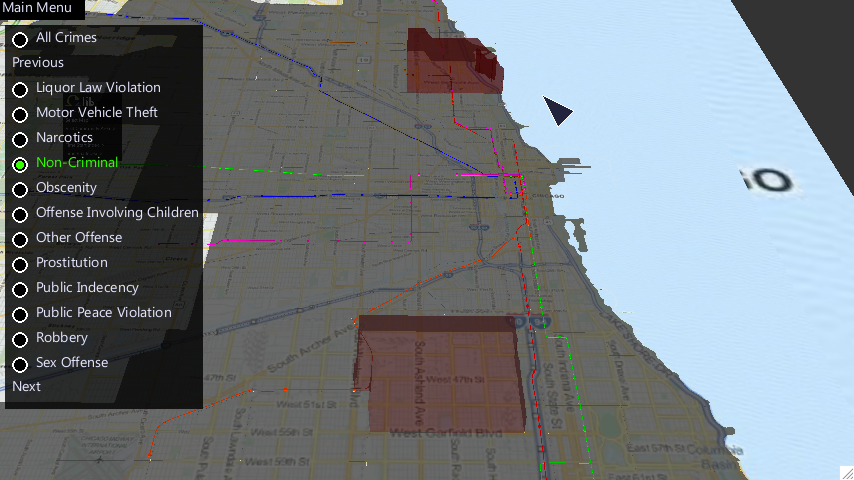
“Crime Type”
This menu has an “All” button, a “Previous” button, a list of n crime type buttons, and a “Next” button. By default, “All” is selected and so the community areas are not limited in which crimes they display. Selecting a crime type button limits each community area to only display crimes of that type. The menu functions the same way that “Visit Community Area” does.
-
“Time Start Index“ and ”Time End Index”
The structure of these menus is identical (both are trees). The first submenu of either lists the years 2011 - 2013 and each is a submenu that lists months. Each control variables that constrain the crimes community areas display and by default display all crimes. If a selection is made that causes an impossible range of time (start index that is later than end index or the opposite problem) then the other index is updated to the same value. For example, if the end index was January 2012 and February 2013 was selected as the start index then the end index would be updated to February 2013 only displaying that month.
CAVE2
CAVE2 has no problem loading all 5,000,000+ crime data entries. The Source Code is written to load all entries.Computer
My laptop has a difficult time running the project with all 5,000,000+ entries loaded (requires about 2GB). For the purpose of testing / running on a computer, I placed a simple code comment at line 122. Uncommenting this allows a subset of the data to be used based on a simple conditional statement such as if YEAR >= 2011.Data Explanation
Community Areas
The data for the community areas can be found here. I manually parsed the data to create a CSV and removed the interior geometry of one community area (it was the only entry that had interior geometry). The only information I retained from the file is the name and a set of latitudes / longitudes that describe the boundaries of each community area. This information was used to represent community areas as extruded polygons and triangularize surface geometry.Crime Data
The data for the 2001 - 2013 crimes can be found here. This file is a CSV containing 5,000,000+ entries (1.15GB) so all modifications I made were done programmatically through a series of transformations:-
parseCrimes.c
This program goes line by line counting the number of commas as some comma separated entries had commas in them... not cool. Any entry with a nonuniform number of commas was removed and the program removed 243,875 lines or about 4% of the original file. -
parseCrimes2.c
Takes as input the output of parseCrimes.c. Uses an array of flags associated with columns and flagged columns are removed:
0 Date 1 Block Removed 2 Primary Type 3 Description Removed 4 Location Description Removed 5 Arrest Removed 6 Domestic Removed 7 X Coordinate Removed 8 Y Coordinate Removed 9 Year Removed 10 Updated On Removed 11 Latitude 12 Longitude 13 / 14 Location Removed
-
removeEndCommas.c
The first parsing program, parseCrimes.c, was not accurate enough when it only checked comma counts. After trying UTM, some lines threw errors and the feature they had in common was a trailing comma at the Updated On entry where utm was looking for Latitude / Longitude. This program removed 76 lines. -
Python Transformations
The final form of the crime data is a CSV where the first column is an association to a community area (that contains the crime). This was done by performing ~400,000,000 point in polygon tests... ~10 hours to complete on my laptop. The other three columns store a reduced form date and UTM converted latitude / longitude.
CTA
This uses two files one for the CTA L Stations and the other for the Lines Connecting Stations. Both were manually parsed to create CSV files for displaying as geometry.Instructions
Source Code
All files needed to run the project AlexChicago.zip.Open the Terminal, navigate to the downloaded directory, and type orun -s alexChicago.py. Being able to run this command requires omegalib to be installed and orun to be configured. As explained in Computer, there is a commented code section to use a subset of crime data if your computer has difficulty with 2GB memory usage.
Credits
This project makes use of omegalib and its modules to navigate and display geometry. It also makes use of a UTM module to convert latitude / longitude to meters.Interesting Findings
The community area Austin has a lot of crime. When calculating the heights / colors of the communities based on the number of crimes I originally found the maximum number of crimes (under crime type and time index restraints) and calculated percent as:percent = community[i].crimeCount/maxCrimes
Where percent was the normalized crime amount of a community. Austin so overshadowed the other communities that the other communities were almost completely white and had no height. I modified percent to use the square root of the community crime and maximum crime count as:
percent = math.sqrt(community[i].crimeCount)/math.sqrt(maxCrimes)
This significantly helped make crime comparisons among other neighborhoods possible however Austin still clearly has the most crime under almost all restraints.